Supercharged uptime monitoring
Upgrade your uptime monitoring with anomaly detection. Get alerted when your URL is down or degraded. Get peace of mind.
Simple to set up. Nothing to install.
Free for 14 days. No credit card required.
World-class uptime monitoring
Be the first to know when your URL is down or degraded.
- Fast and complete checks
- Tally tests your URL every minute, requesting a full header and body response, not just a HEAD request.
- Flexible alerting
- Alert your team by SMS, email, or Slack. You choose who gets notified, using the best method for each person.
- False positive filtering
- Outages and anomalies are verified from a separate location, preventing false positive alerts.
- Context-rich reports
- Outage and degradation reports include latency measurements leading up to the event, helping you to track down the cause.
- Customizable requests
- Specify the HTTP method, add custom headers, and include payload/data with each request to your URL.
- TLS/SSL Certificate Monitoring
- Automatically receive upcoming TLS/SSL certificate expiration notices, starting 14-days before the expiration. Alerts automatically escalate.
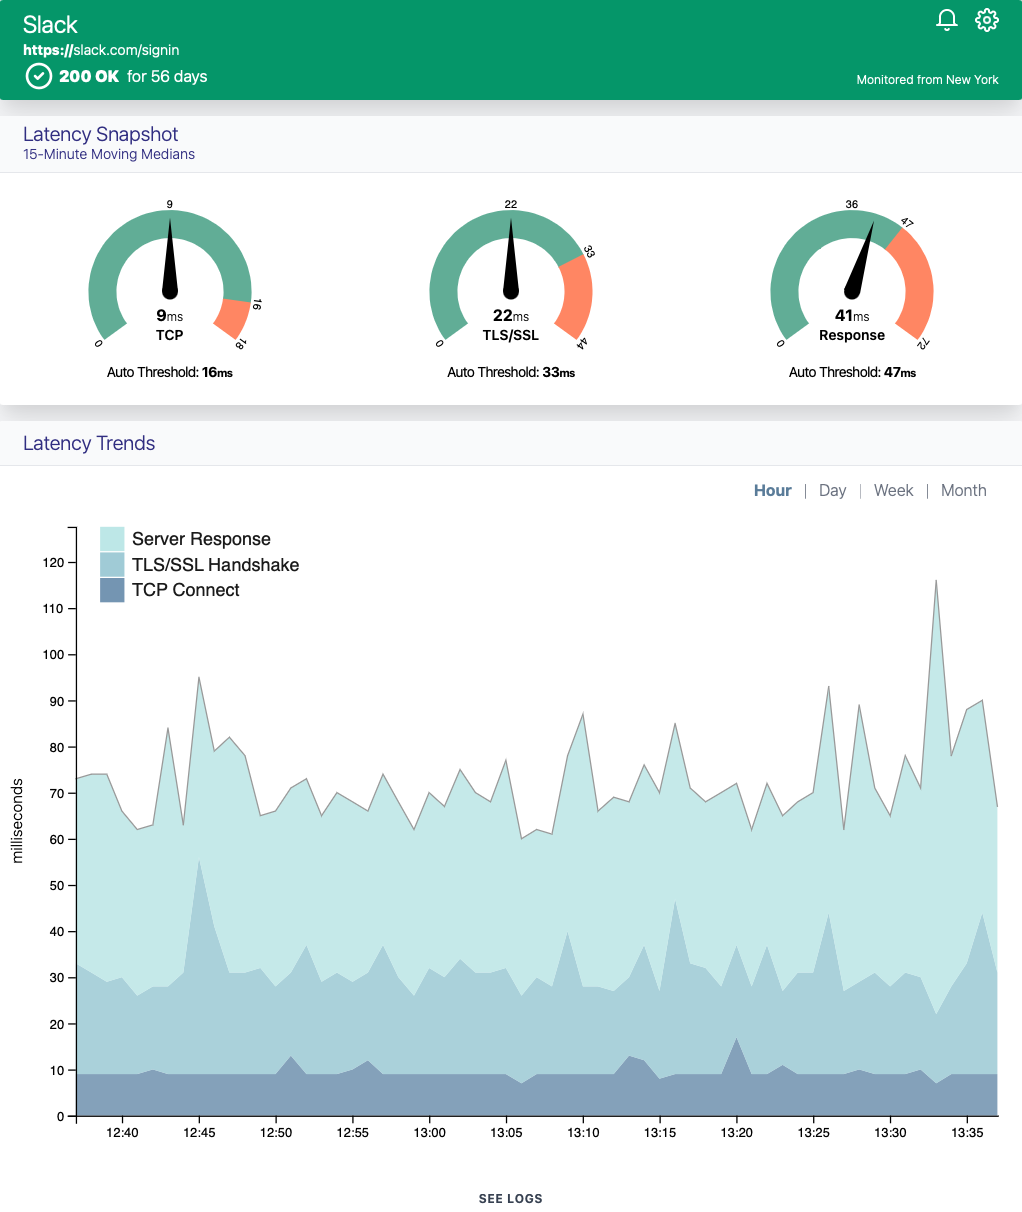
Dynamic anomaly detection
Tally's dynamic anomaly detection alerts you when your URL's responsiveness slows down unexpectedly.
We focus on your URL from a single monitoring location, benchmarking your endpoint's network, TLS/SSL, and server response latencies.
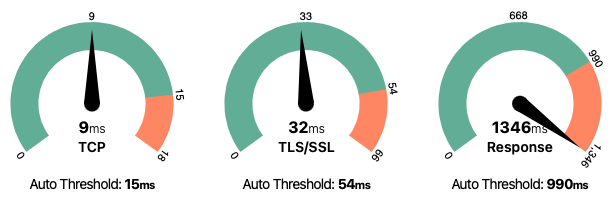
By analyzing these measurements over time, we determine their variability and calculate an Auto Threshold for each latency. So you know what is and isn't normal.
You don't need to try to guess at thresholds or mess around with abstractions like Apdex. The Auto Threshold is based on a statistical analysis of your URL's unique behavior, and updates daily.
Measure individual latencies
Each time a client connects to your endpoint, the following network steps take place.
Tally measures each of these steps, but focuses on the three that you can do the most about.
TCP Connect
The amount of time to initially connect to the IP address resolved by the DNS lookup. This latency provides a view of network performance, with longer than normal durations indicating network congestion. Depending on your infrastructure, this initial connection could be either to your server, your load balancer, or your CDN.TLS/SSL Handshake
The time needed to exchange encryption keys and establish a secure HTTPS connection. This takes place either on your server, your load balancer, a TLS/SSL appliance, or your CDN.Server Response
The time used by your server to process the request and respond. When this latency alone increases, you know that you have a performance issue with your server; either with the server's resources (CPU, RAM, etc), changes in your application code, inefficient database queries, or potentially indicating the need for an added database index.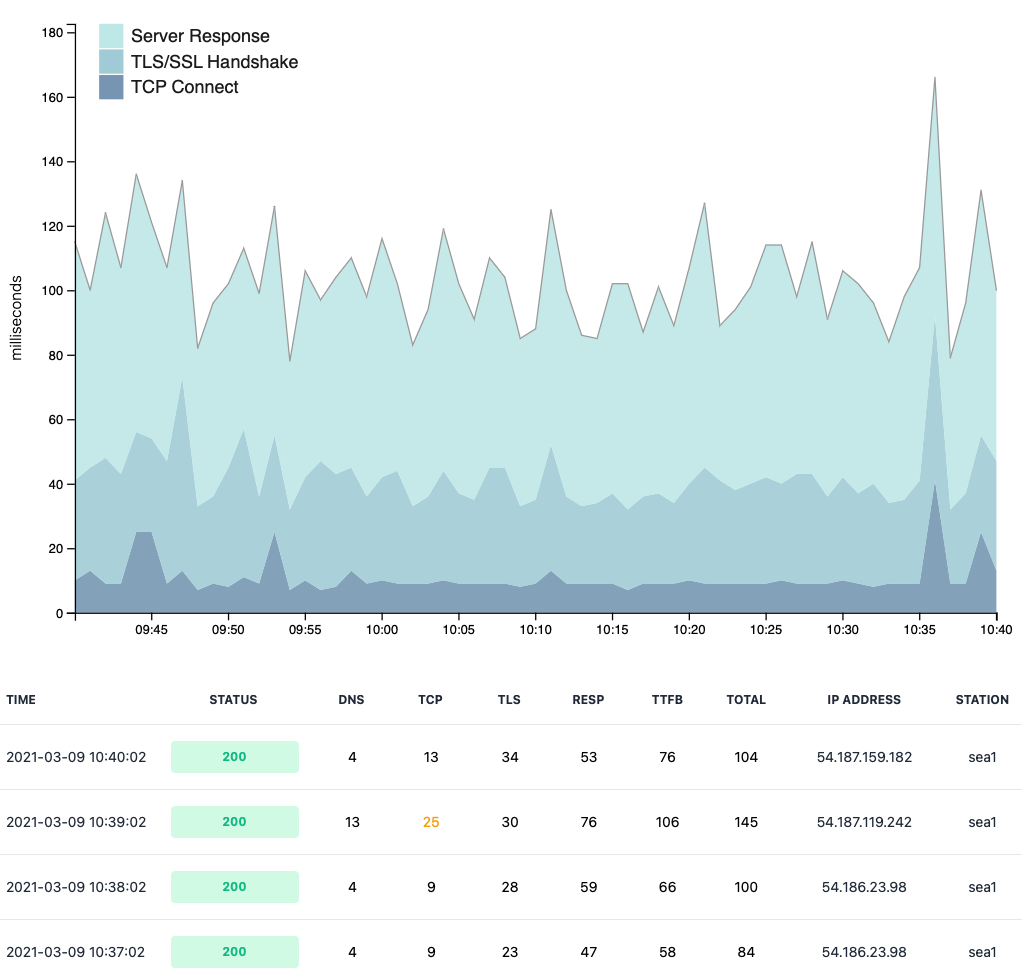
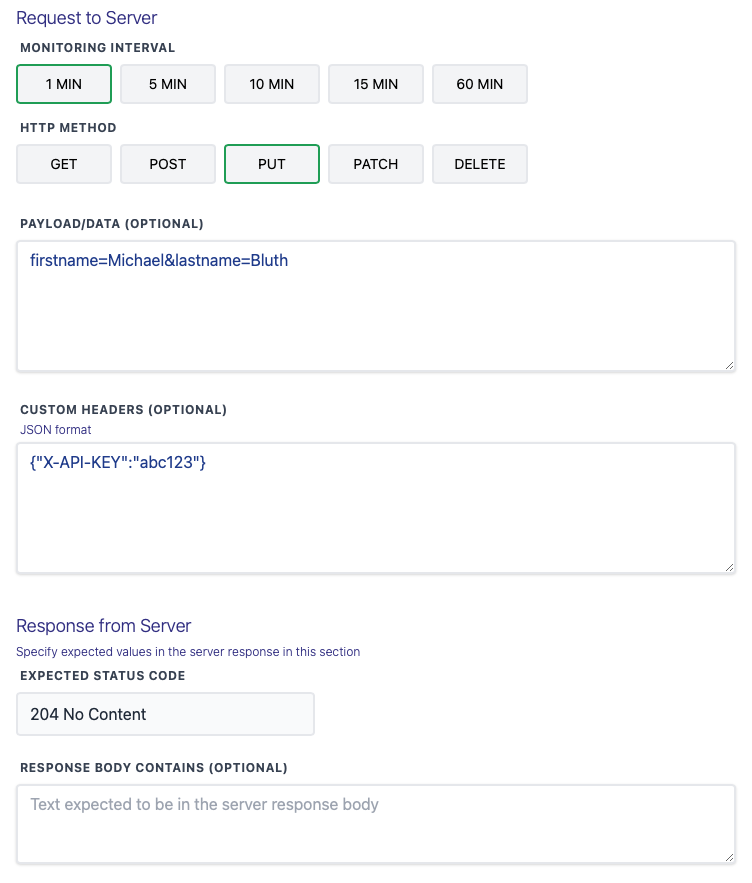
Track API endpoint health
Whether you need to make sure your own API is up and responsive, or you need to make sure an API you depend on is healthy, you can customize the request sent to the API and check that the response returned is correct.
In the request sent to the server, choose the HTTP method, payload, and headers.
For the response from the server, specify the expected HTTP status code returned, as well as text that must be present in the body of the response.
And with Auto Thresholds and anomaly detection, you can get alerted if the API is responding too slow.
Pricing Plans
Free 14-day free trial. No credit card required for trial.
Get 2 months free when you pay yearly.
Starter
Billed monthly
Billed yearly
-
10 monitors
-
50 SMS credits
-
Solo account
Standard
Billed monthly
Billed yearly
-
20 monitors
-
100 SMS credits
-
5 Team Members
Plus
Billed monthly
Billed yearly
-
50 monitors
-
250 SMS credits
-
Unlimited Team Members